|
1
|
When the icon is clicked, the General information box appears, displaying the following:
|
■
|
'Hostname': Displays the device's hostname (if configured). If empty, you can enter a hostname and then click  to apply it. You can also configure a hostname as described in Configuring a Hostname for the Device. to apply it. You can also configure a hostname as described in Configuring a Hostname for the Device. |
|
■
|
'Operational State': Displays the device’s operational status: |
|
■
|
'S/N': Displays the device's serial number (click  if you want to copy it to your clipboard) if you want to copy it to your clipboard) |
|
■
|
'Product Key': device's product key |
|
■
|
'License Key': Type of License Key (e.g., "Local") used by the device (for more information, see License Key) |
|
■
|
'QOE Status': Indicates if the device reports Quality of Experience (QoE) voice metric to OVOC (see Reporting QoE to OVOC for more information): |
|
■
|
'OVOC Connectivity': Indicates the connectivity status between the device and OVOC, which is used by the device to send SNMP traps to OVOC, and by OVOC to perform various operations on the device such as software updates (see Configuring SNMP for OVOC Connectivity for more information). |
|
|
2
|
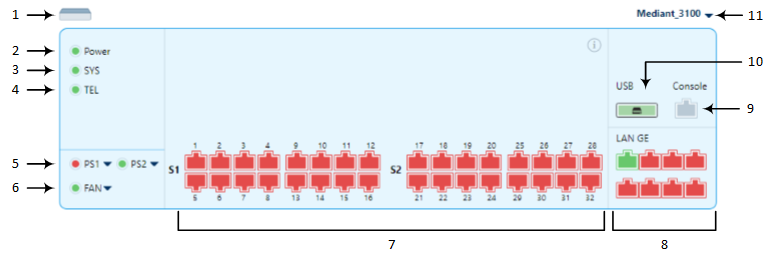
Power LED, displaying the status of the Power Supply modules:
|
■
|
Green: The Power Supply modules are
operating normally.
|
|
■
|
Red: One of the Power Supply modules is faulty |
|
|
3
|
SYS LED, displaying the device's operating status:
|
■
|
Green: The device is operating normally . |
|
■
|
Orange: The chassis is approaching the high temperature threshold (but not critical).
|
|
■
|
Red: A fatal error has occurred or the chassis is approaching the critical high temperature threshold. |
|
|
4
|
TEL LED, displaying the status of the E1/T1 interfaces:
|
■
|
Green: Operating normally
|
|
■
|
Orange: One or more E1/T1 interfaces are temporary out-of-service.
|
|
■
|
Red: One or more E1/T1 interfaces are out-of-service. |
|
|
5
|
PS1 and PS2 LEDs, displaying the status of Power Supply module #1 and Power Supply module #2, respectively
|
■
|
Green: The DC power output is good. |
|
■
|
Red: The Power Supply module is not operating properly. |
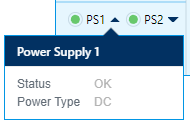
If you click a LED, a drop-down information box appears, displaying the following:
|
■
|
'Power Type': Displays the type of power: |
|
✔
|
"AC": An AC Power Supply module is installed in the chassis and connected to power. |
|
✔
|
"DC": A DC Power Supply module is installed in the chassis and connected to power. |
|
✔
|
"N/A": No Power Supply module is installed in the chassis slot, or a new Power Supply module is installed but not yet connected to power (DC or AC). |
Below shows an example of an information box when PS1 is clicked:

|
|
6
|
FAN LED, displaying the status of the Fan Tray module:
|
■
|
Green: The Fan Tray module is operating normally. |
|
■
|
Red: One or more fans of the Fan Tray module are faulty or the module is not installed. |
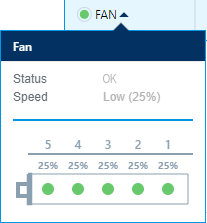
If you click the LED, a drop-down information box appears, displaying the following:
|
✔
|
"Medium (50%)" - orange |
Below shows an example of an information box when the LED is clicked:

|
|
7
|
RJ-48C port icons, displaying the status of the E1/T1 interfaces:
|
■
|
Gray: "Disabled" - trunk is not configured. |
|
■
|
Green: "Active" - trunk is configured and synchronized. |
|
■
|
Yellow: "RAI Alarm " - trunk has a Remote Alarm Indication (RAI), also known as the Yellow Alarm |
|
■
|
Red: "LOS/LOF Alarm" - trunk has a loss due to LOS (Loss of Signal) or LOF (Loss of Frame).
|
|
■
|
Light blue: "AIS Alarm" - trunk has an Alarm Indication Signal (AIS), also known as the Blue Alarm |
|
■
|
Orange: "D-Channel Alarm" - trunk has a D-channel alarm. |
|
■
|
Orange: "NFAS Alarm" - trunk has an NFAS alarm. |
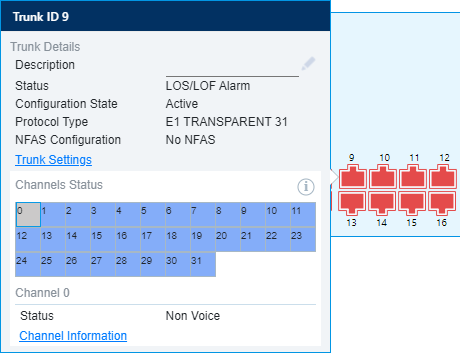
If you click a status icon, an information box appears, as shown in the following example:

|
■
|
'Description': Displays the descriptive name of the port (if configured). If you want to configure a description, click the line, type a description, and then click  to save. to save. |
|
■
|
'Status': Displays the E1/T1 interface status (listed previously). |
|
■
|
'Configuration State': "Active", "Inactive",
"Not Configured",
or "Lower Layer Down"
|
|
■
|
'Protocol Type': Displays the PSTN protocol variant configured for the E1/T1 interface. |
|
■
|
'NFAS Configuration': Indicates if the interface is part of an NFAS group: "No NFAS", "Primary", "Backup", "NFAS", or "N/A" |
|
■
|
Trunk Settings link: Click this link to open the Trunk Settings page, where this trunk was configured. For more information on configuring trunks, see Configuring Trunk Settings. |
|
■
|
'Channel Status' table: Displays the status of each channel in the trunk ( click  to view a legend of the status color codes): to view a legend of the status color codes): |
|
✔
|
Light blue: (Inactive) channel is configured, but currently no calls |
|
✔
|
Gray: (Non Voice) channel is not configured |
|
✔
|
Green: (Active) a call is in progress (RTP traffic) and no alarms |
|
✔
|
Blue: (ISDN Signaling) channel is configured as the D-channel |
|
✔
|
Orange: (Maintenance) B-channel has been intentionally taken out of service due to maintenance |
|
✔
|
Red: (Out Of Service) B-channel is out of service |
If you click a channel, the following information is displayed below the table:
|
✔
|
'Status': Displays the status of the channel (see previous list of statuses) |
|
✔
|
'Trunk Group': Displays the Trunk Group to which the channel belongs |
|
✔
|
'
Call State': "Idle", "Setup",
"Alert",
"Ringback",
"Session",
or "Release"
|
|
✔
|
Channel Information link: Click this link to view detailed information and statistics of the selected channel. For more information, see Viewing Voice Channel Information. |
|
|
8
|
Gigabit Ethernet port status icons:
|
■
|
Green: "Connected" - Ethernet link is working.
|
|
■
|
Gray: Ethernet link is not configured.
|
|
■
|
Red: "Disconnected" - Ethernet link error
|
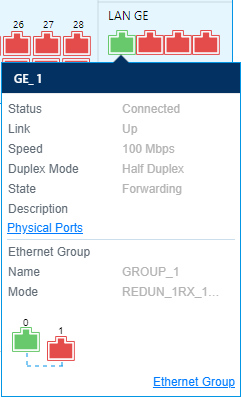
If you click a status icon, an information box appears, as shown in the following example:

|
■
|
Ethernet Group: Displays the Ethernet Group of the port: |
|
✔
|
'Name': Displays the name of the Ethernet Group |
|
✔
|
'Mode': Displays the mode of the Ethernet Group |
|
✔
|
The image shows the ports sharing the Ethernet Group, including the status of each port. For example, the previous figure indicates that this Ethernet Group is shared by port 1 and 2 (denoted as GE_0 and GE_1 in the code) |
|
|
9
|
Serial (CONSOLE) port status icon, indicating if the port is connected to the serial cable:
|
■
|
Gray: Port is not connected |
|
■
|
Green: Port is connected |
|
|
10
|
USB port status icon, indicating if the port is connected to a USB storage device:
|
|
11
|
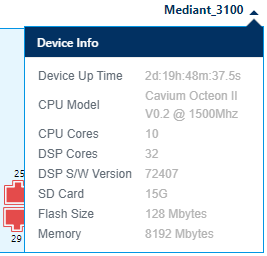
When the product model name is clicked, the Device information box appears, displaying the following:

|
■
|
'Device Up Time': Duration that the device has been up and running since the last restart (uptime). The duration is displayed in the following format: dd:hh:mm:ss.ss. |
|
■
|
'CPU Model': Model name of the CPU |
|
■
|
'CPU Cores': Number of CPU cores |
|
■
|
'DSP Cores': Number of DSP cores |
|
■
|
'DSP S/W Version': DSP software version |
|
■
|
'SD Card': Storage capacity of SD card |
|
■
|
'Flash Size': Storage size of flash memory |
|
■
|
'Memory': DDR memory size |
|


 if you want to copy it to your clipboard)